Manufacturing · Consulting
Turning strategy into a measurable operating agenda
A strategy map and cascaded Balanced Scorecard helped a manufacturer connect strategic priorities with clearer objectives, performance measures, and team-level execution.
01 · Context
The challenge
- Lack of clear company direction.
- Poor performance measurement.
- Limited communication.
- Inability to align objectives.
- Ineffective resource allocation.
- Reduced accountability.
- Short-term focus.
- Lack of strategic execution.
02 · Delivery
The approach
- 01Defined the vision, mission, and core values.
- 02Conducted a SWOT analysis.
- 03Mapped cause-and-effect relationships.
- 04Set targets and initiatives.
- 05Developed a communication strategy.
- 06Identified strategic objectives.
- 07Established scorecard perspectives.
- 08Developed strategic themes.
- 09Set key performance indicators.
- 10Developed a company-level scorecard.
- 11Developed cascaded scorecards.
- 12Established monitoring and review.
Engagement evidence
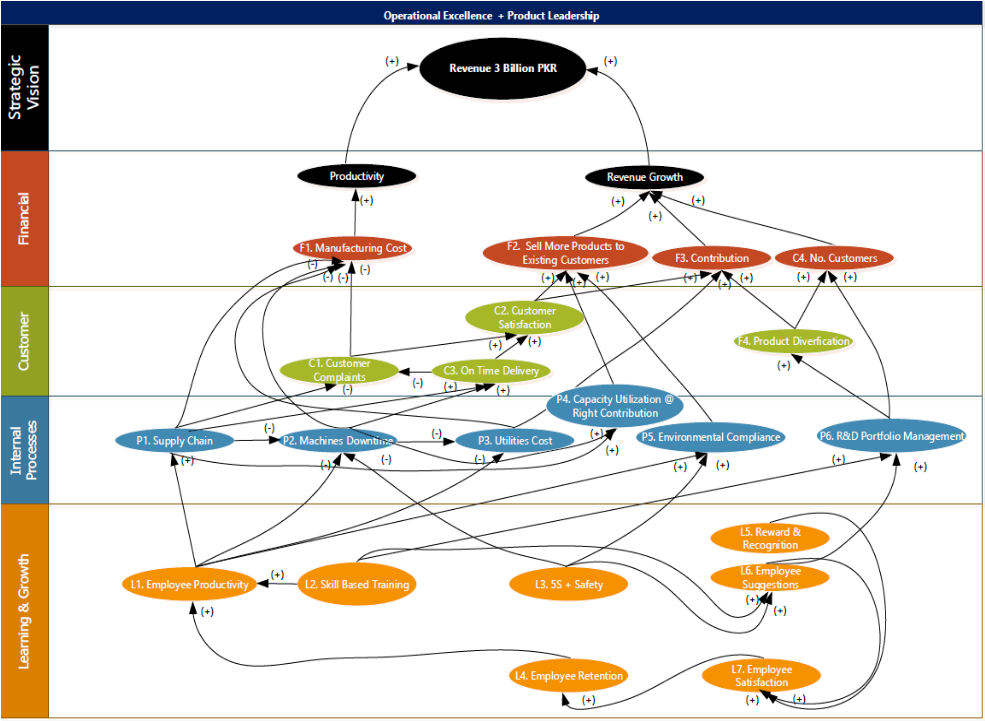
Strategy map and Balanced Scorecard
Three-month Balanced Scorecard
Targets, actuals, variances, and weighted scores reproduced from the source report.
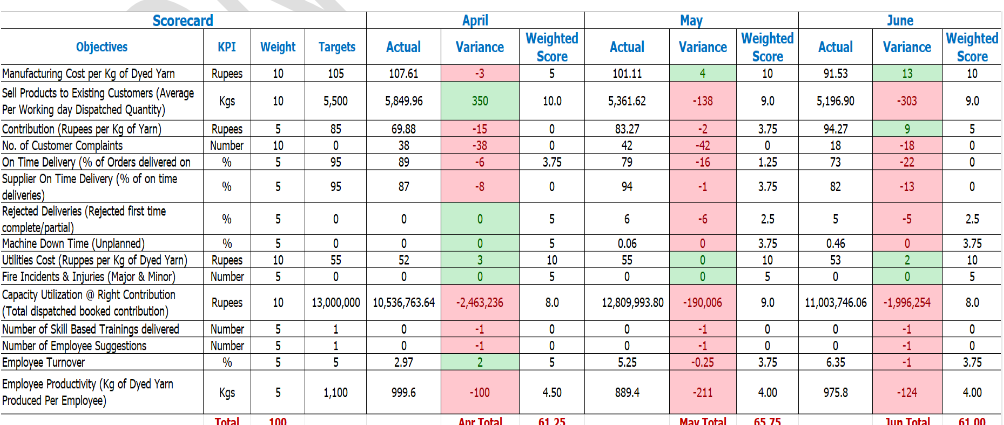
| Objective | KPI | Weight | Target | April | May | June | ||||||
|---|---|---|---|---|---|---|---|---|---|---|---|---|
| Actual | Variance | Weighted score | Actual | Variance | Weighted score | Actual | Variance | Weighted score | ||||
| Manufacturing cost per kg of dyed yarn | Rupees | 10 | 105 | 107.61 | -3 | 5 | 101.11 | 4 | 10 | 91.53 | 13 | 10 |
| Products sold to existing customers (average daily dispatch) | Kg | 10 | 5,500 | 5,849.96 | 350 | 10.0 | 5,361.62 | -138 | 9.0 | 5,196.90 | -303 | 9.0 |
| Contribution per kg of yarn | Rupees | 5 | 85 | 69.88 | -15 | 0 | 83.27 | -2 | 3.75 | 94.27 | 9 | 5 |
| Customer complaints | Number | 10 | 0 | 38 | -38 | 0 | 42 | -42 | 0 | 18 | -18 | 0 |
| On-time order delivery | % | 5 | 95 | 89 | -6 | 3.75 | 79 | -16 | 1.25 | 73 | -22 | 0 |
| Supplier on-time delivery | % | 5 | 95 | 87 | -8 | 0 | 94 | -1 | 3.75 | 82 | -13 | 0 |
| First-time complete/partial rejected deliveries | % | 5 | 0 | 0 | 0 | 5 | 6 | -6 | 2.5 | 5 | -5 | 2.5 |
| Unplanned machine downtime | % | 5 | 0 | 0 | 0 | 5 | 0.06 | 0 | 3.75 | 0.46 | 0 | 3.75 |
| Utilities cost per kg of dyed yarn | Rupees | 10 | 55 | 52 | 3 | 10 | 55 | 0 | 10 | 53 | 2 | 10 |
| Major and minor fire incidents and injuries | Number | 5 | 0 | 0 | 0 | 5 | 0 | 0 | 5 | 0 | 0 | 5 |
| Capacity utilization at right contribution | Rupees | 10 | 13,000,000 | 10,536,763.64 | -2,463,236 | 8.0 | 12,809,993.80 | -190,006 | 9.0 | 11,003,746.06 | -1,996,254 | 8.0 |
| Skill-based training delivered | Number | 5 | 1 | 0 | -1 | 0 | 0 | -1 | 0 | 0 | -1 | 0 |
| Employee suggestions | Number | 5 | 1 | 0 | -1 | 0 | 0 | -1 | 0 | 0 | -1 | 0 |
| Employee turnover | % | 5 | 5 | 2.97 | 2 | 5 | 5.25 | -0.25 | 3.75 | 6.35 | -1 | 3.75 |
| Dyed yarn produced per employee | Kg | 5 | 1,100 | 999.6 | -100 | 4.50 | 889.4 | -211 | 4.00 | 975.8 | -124 | 4.00 |
| Total weighted score | 100 | — | April: 61.25 | May: 65.75 | June: 61.00 | |||||||
Values and rounding follow the source scorecard. Employee-identifying details are not included.
Source report detail
Project timeline and takeaways
Delivery timeline
- 2 weeksScorecard and strategy-map developmentPhase 1
- 4 weeksImplementationPhase 2
Findings and recommendations in the report
- Aligned the scorecard with organizational goals.
- Defined clear objectives.
- Established cause-and-effect relationships.
- Focused performance measures.
- Prioritized strategic initiatives.
- Supported alignment across teams.
- Integrated organizational values and culture.
- Established continuous progress monitoring.
- Supported communication across organizational levels.
- The source report includes a strategy map and a three-month Balanced Scorecard; the scorecard's objectives, targets, actuals, variances, and scores are reproduced in the evidence table.
Client and employee identities are withheld. Reported figures are retained as source claims; discrepancies are noted rather than silently corrected.
03 · Outcomes
What changed
- 01A strategy map connected objectives across financial, customer, internal-process, and learning-and-growth perspectives.
- 02Focused measures, targets, and prioritized initiatives were documented.
- 03Cascaded scorecards were designed to support alignment and accountability across teams.
- 04The engagement established a recurring process for progress review and communication; the source lists two weeks for development and four weeks for implementation.
Client identity is withheld. Outcomes and measures are presented as documented in the engagement source material.