Textile Manufacturing · Consulting
Improving textile production with TPM, SMED, and standard work
A multi-machine improvement program combined TPM, SMED, 5S, maintenance standards, and downtime tracking to address stoppages, changeovers, energy use, and production losses.
- USD 18,270.51
- reported average monthly fuel saving across 3 machines
- 221,335 m
- reported average monthly production increase across 3 machines
- 12.27%
- reported increase in OEE
01 · Context
The challenge
- Excessive machine downtime due to lack of Total Productive Maintenance.
- A large number of style changeovers.
- Excessive energy consumption associated with poor machine maintenance.
- Lower hourly production because of machine breakage and slower speeds.
- No standard operating procedures were in place.
- No machine-maintenance KPIs were in place.
- No safety measures were in place.
02 · Delivery
The approach
- 01Collected monthly changeover counts.
- 02Measured the distance traveled by machine operators.
- 03Established a baseline for changeover duration.
- 04Trained the team in and implemented Lean Total Productive Maintenance.
- 05Applied Lean SMED (Single Minute Exchange of Die).
- 06Implemented a machine-filter-cleaning SOP.
- 07Developed machine-downtime codes and implemented data recording.
- 08Identified and eliminated safety issues.
- 09Developed and implemented a machine-nozzle-cleaning SOP.
- 10Recorded baseline daily average production and fuel consumption.
- 11Trained the team in and implemented 5S.
Engagement evidence
Measures and working visuals
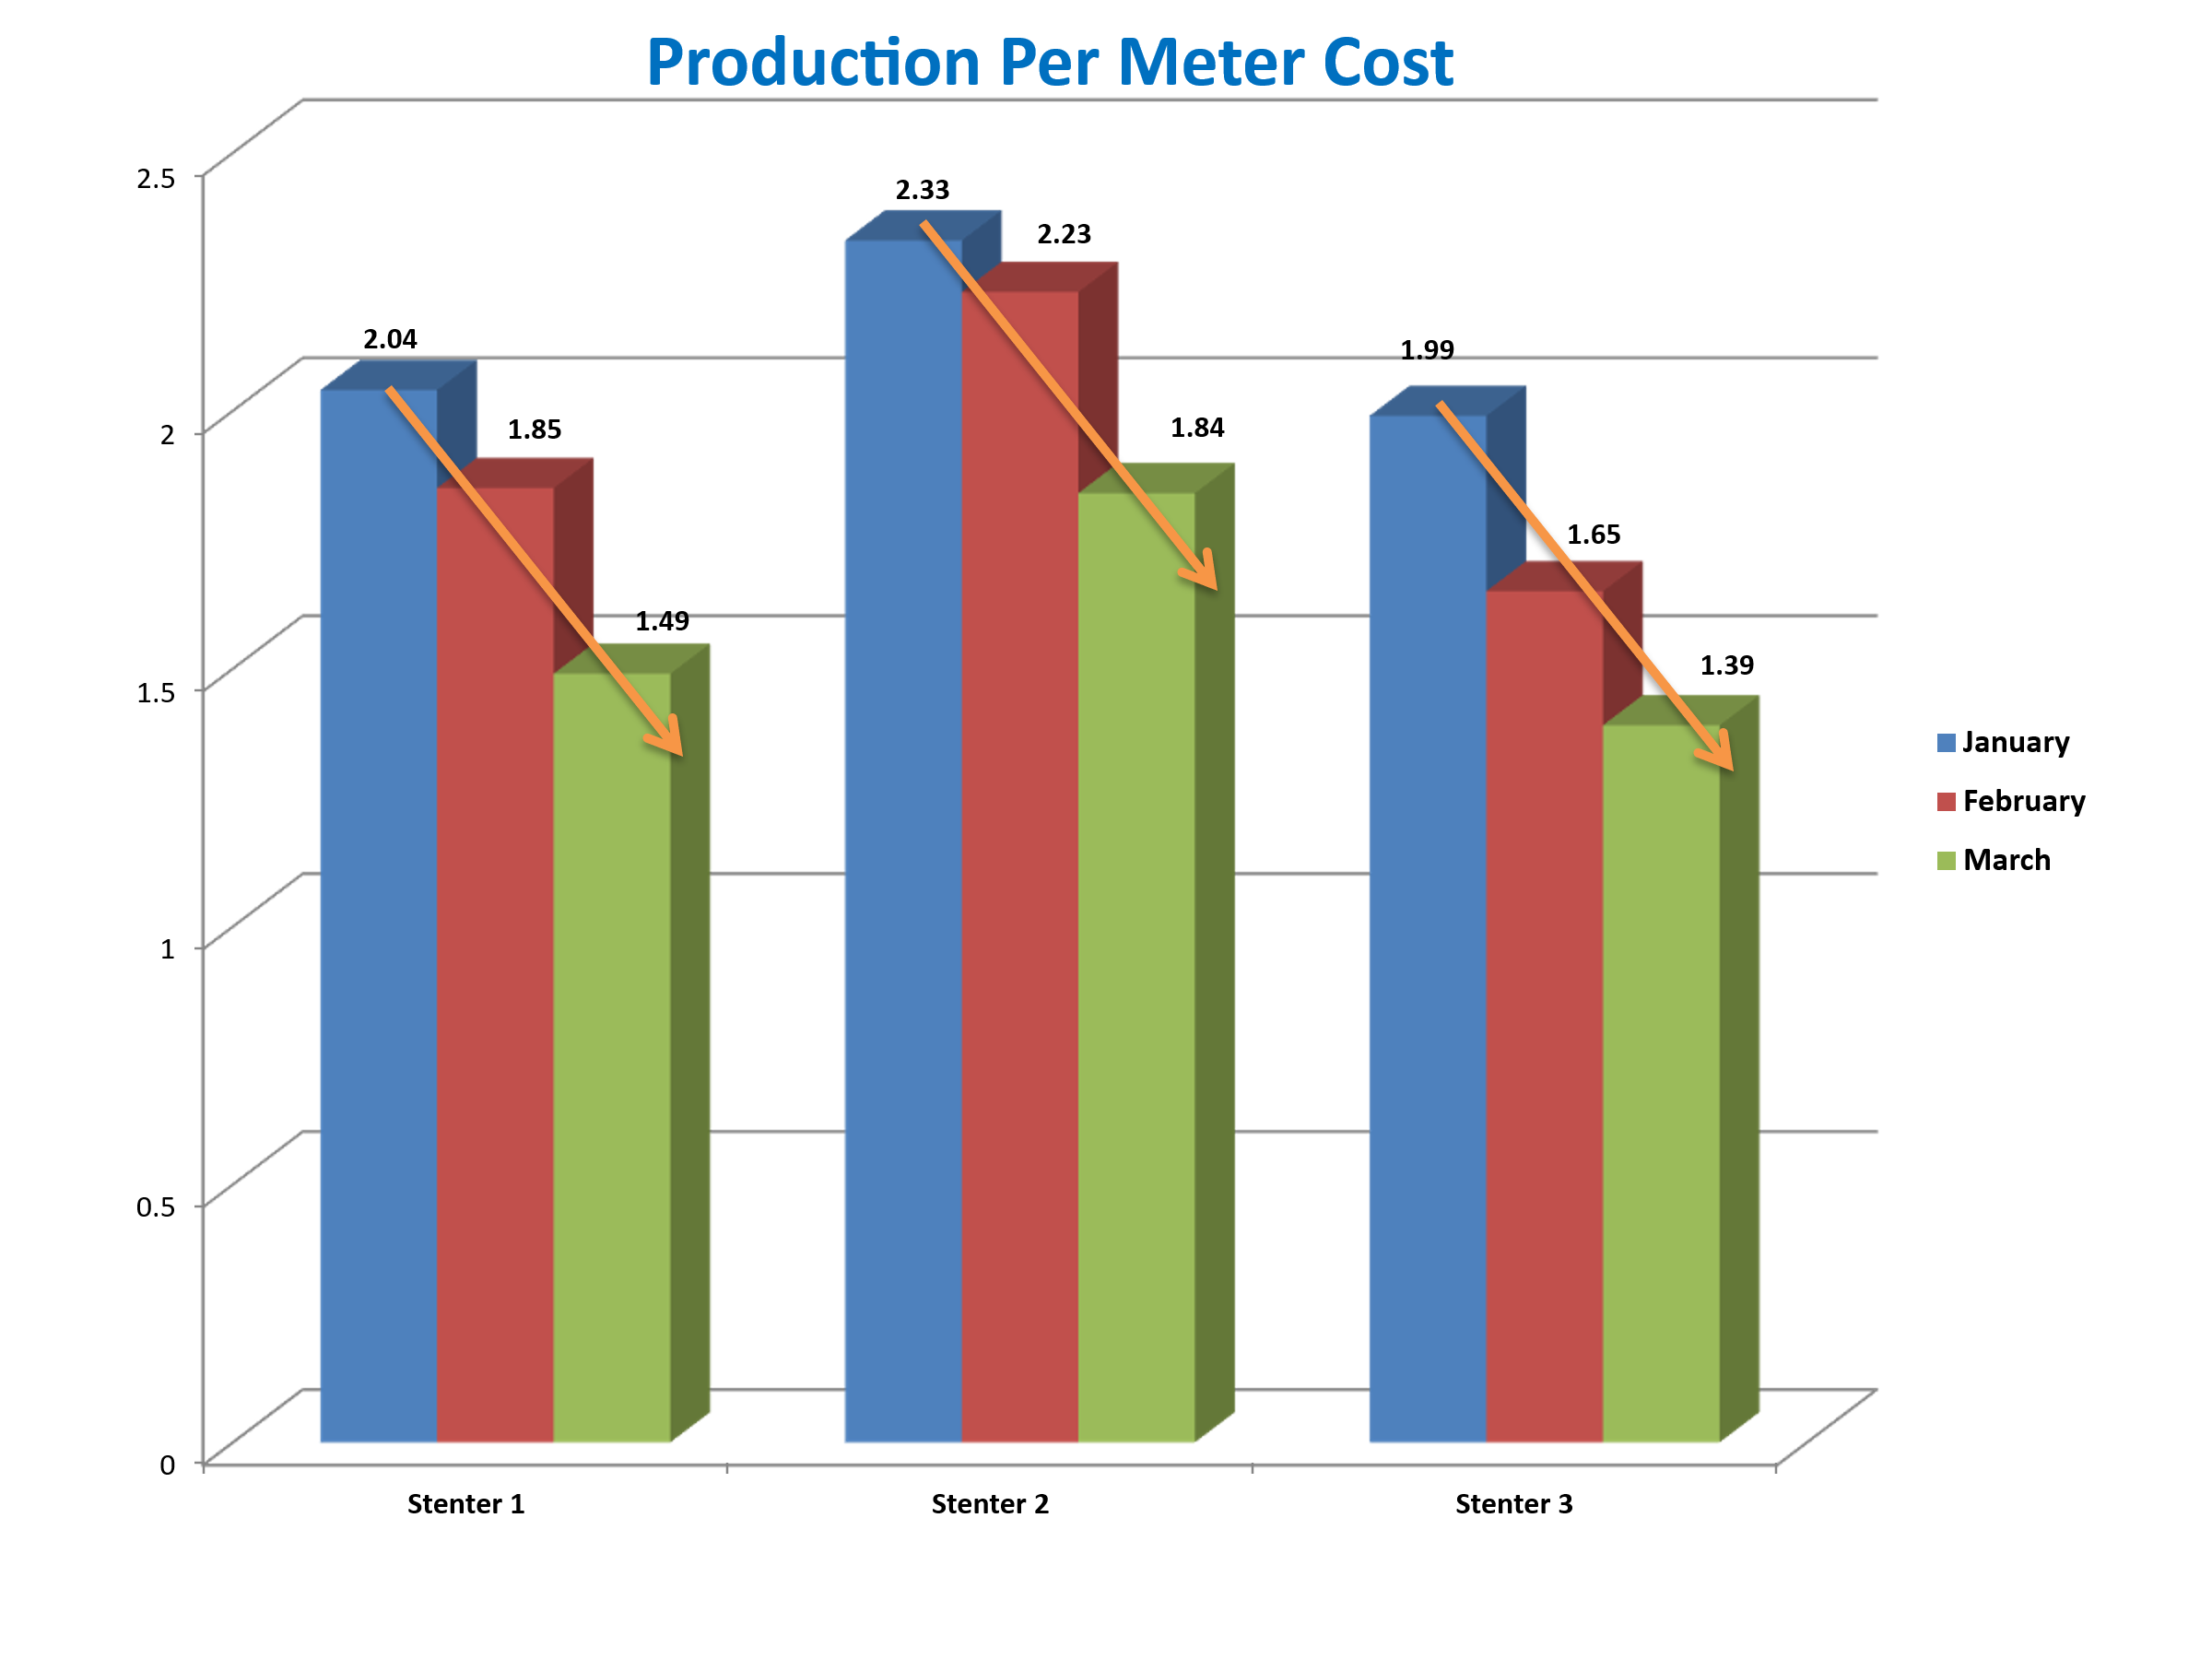
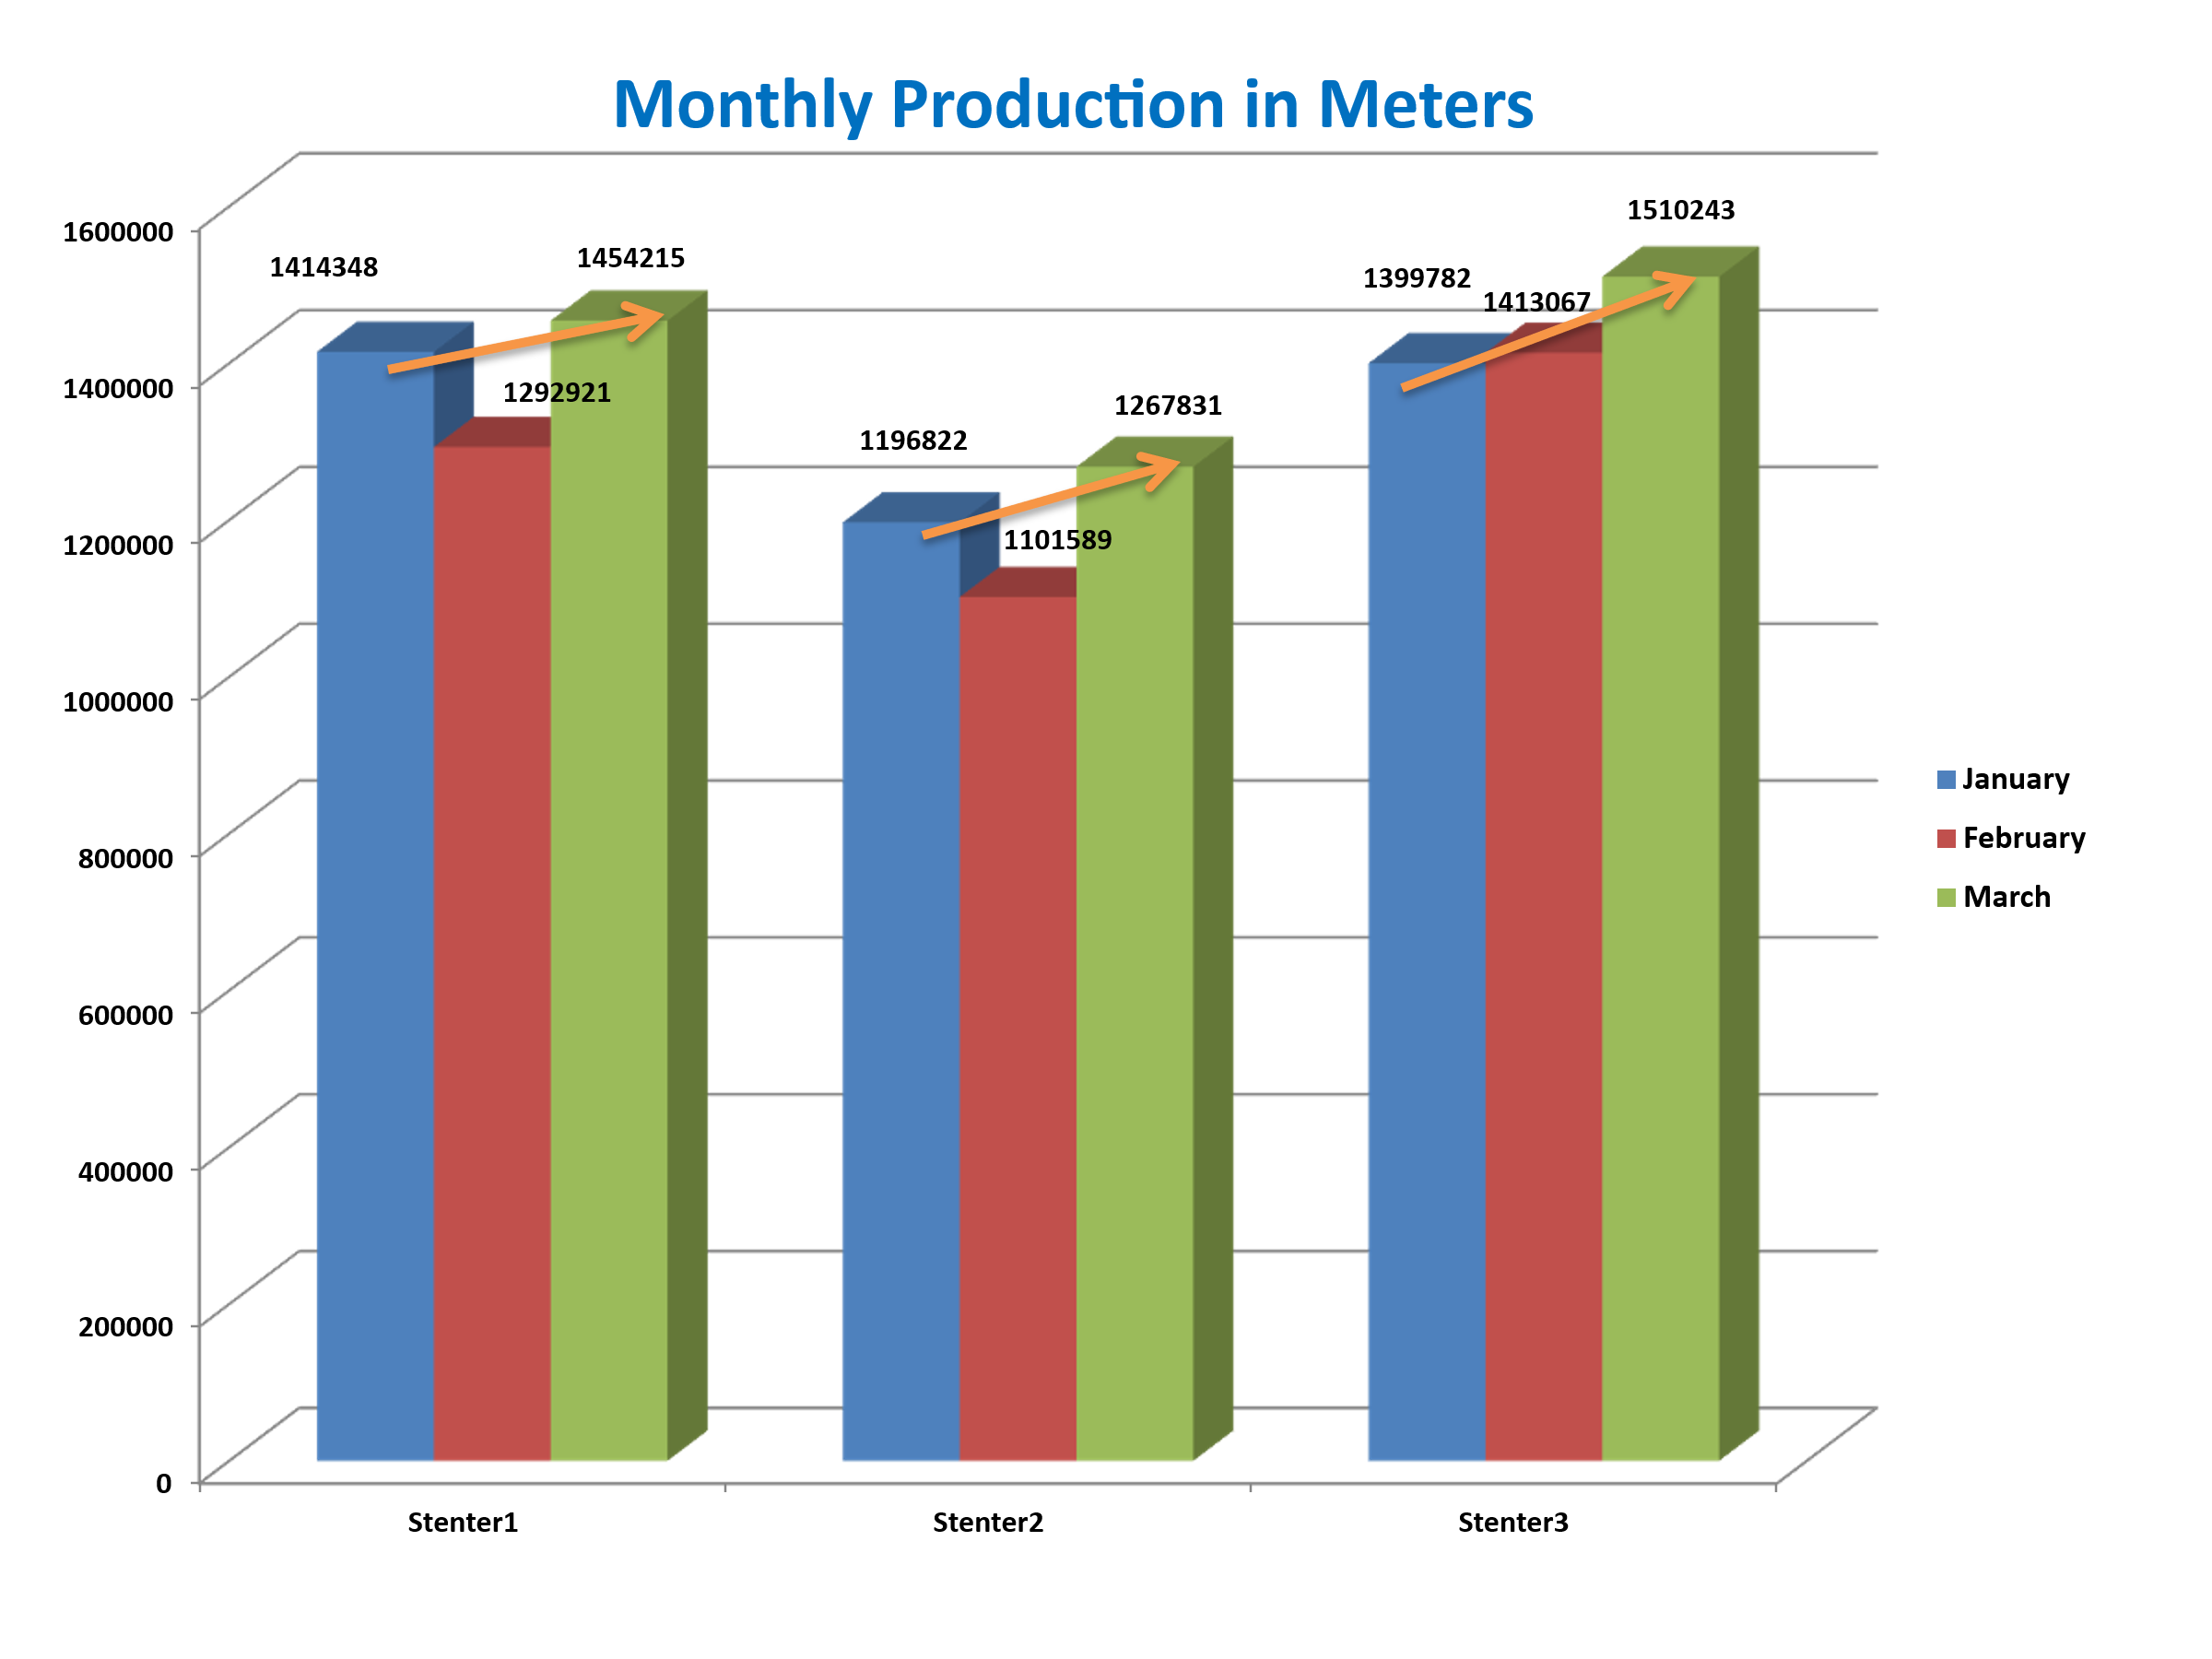
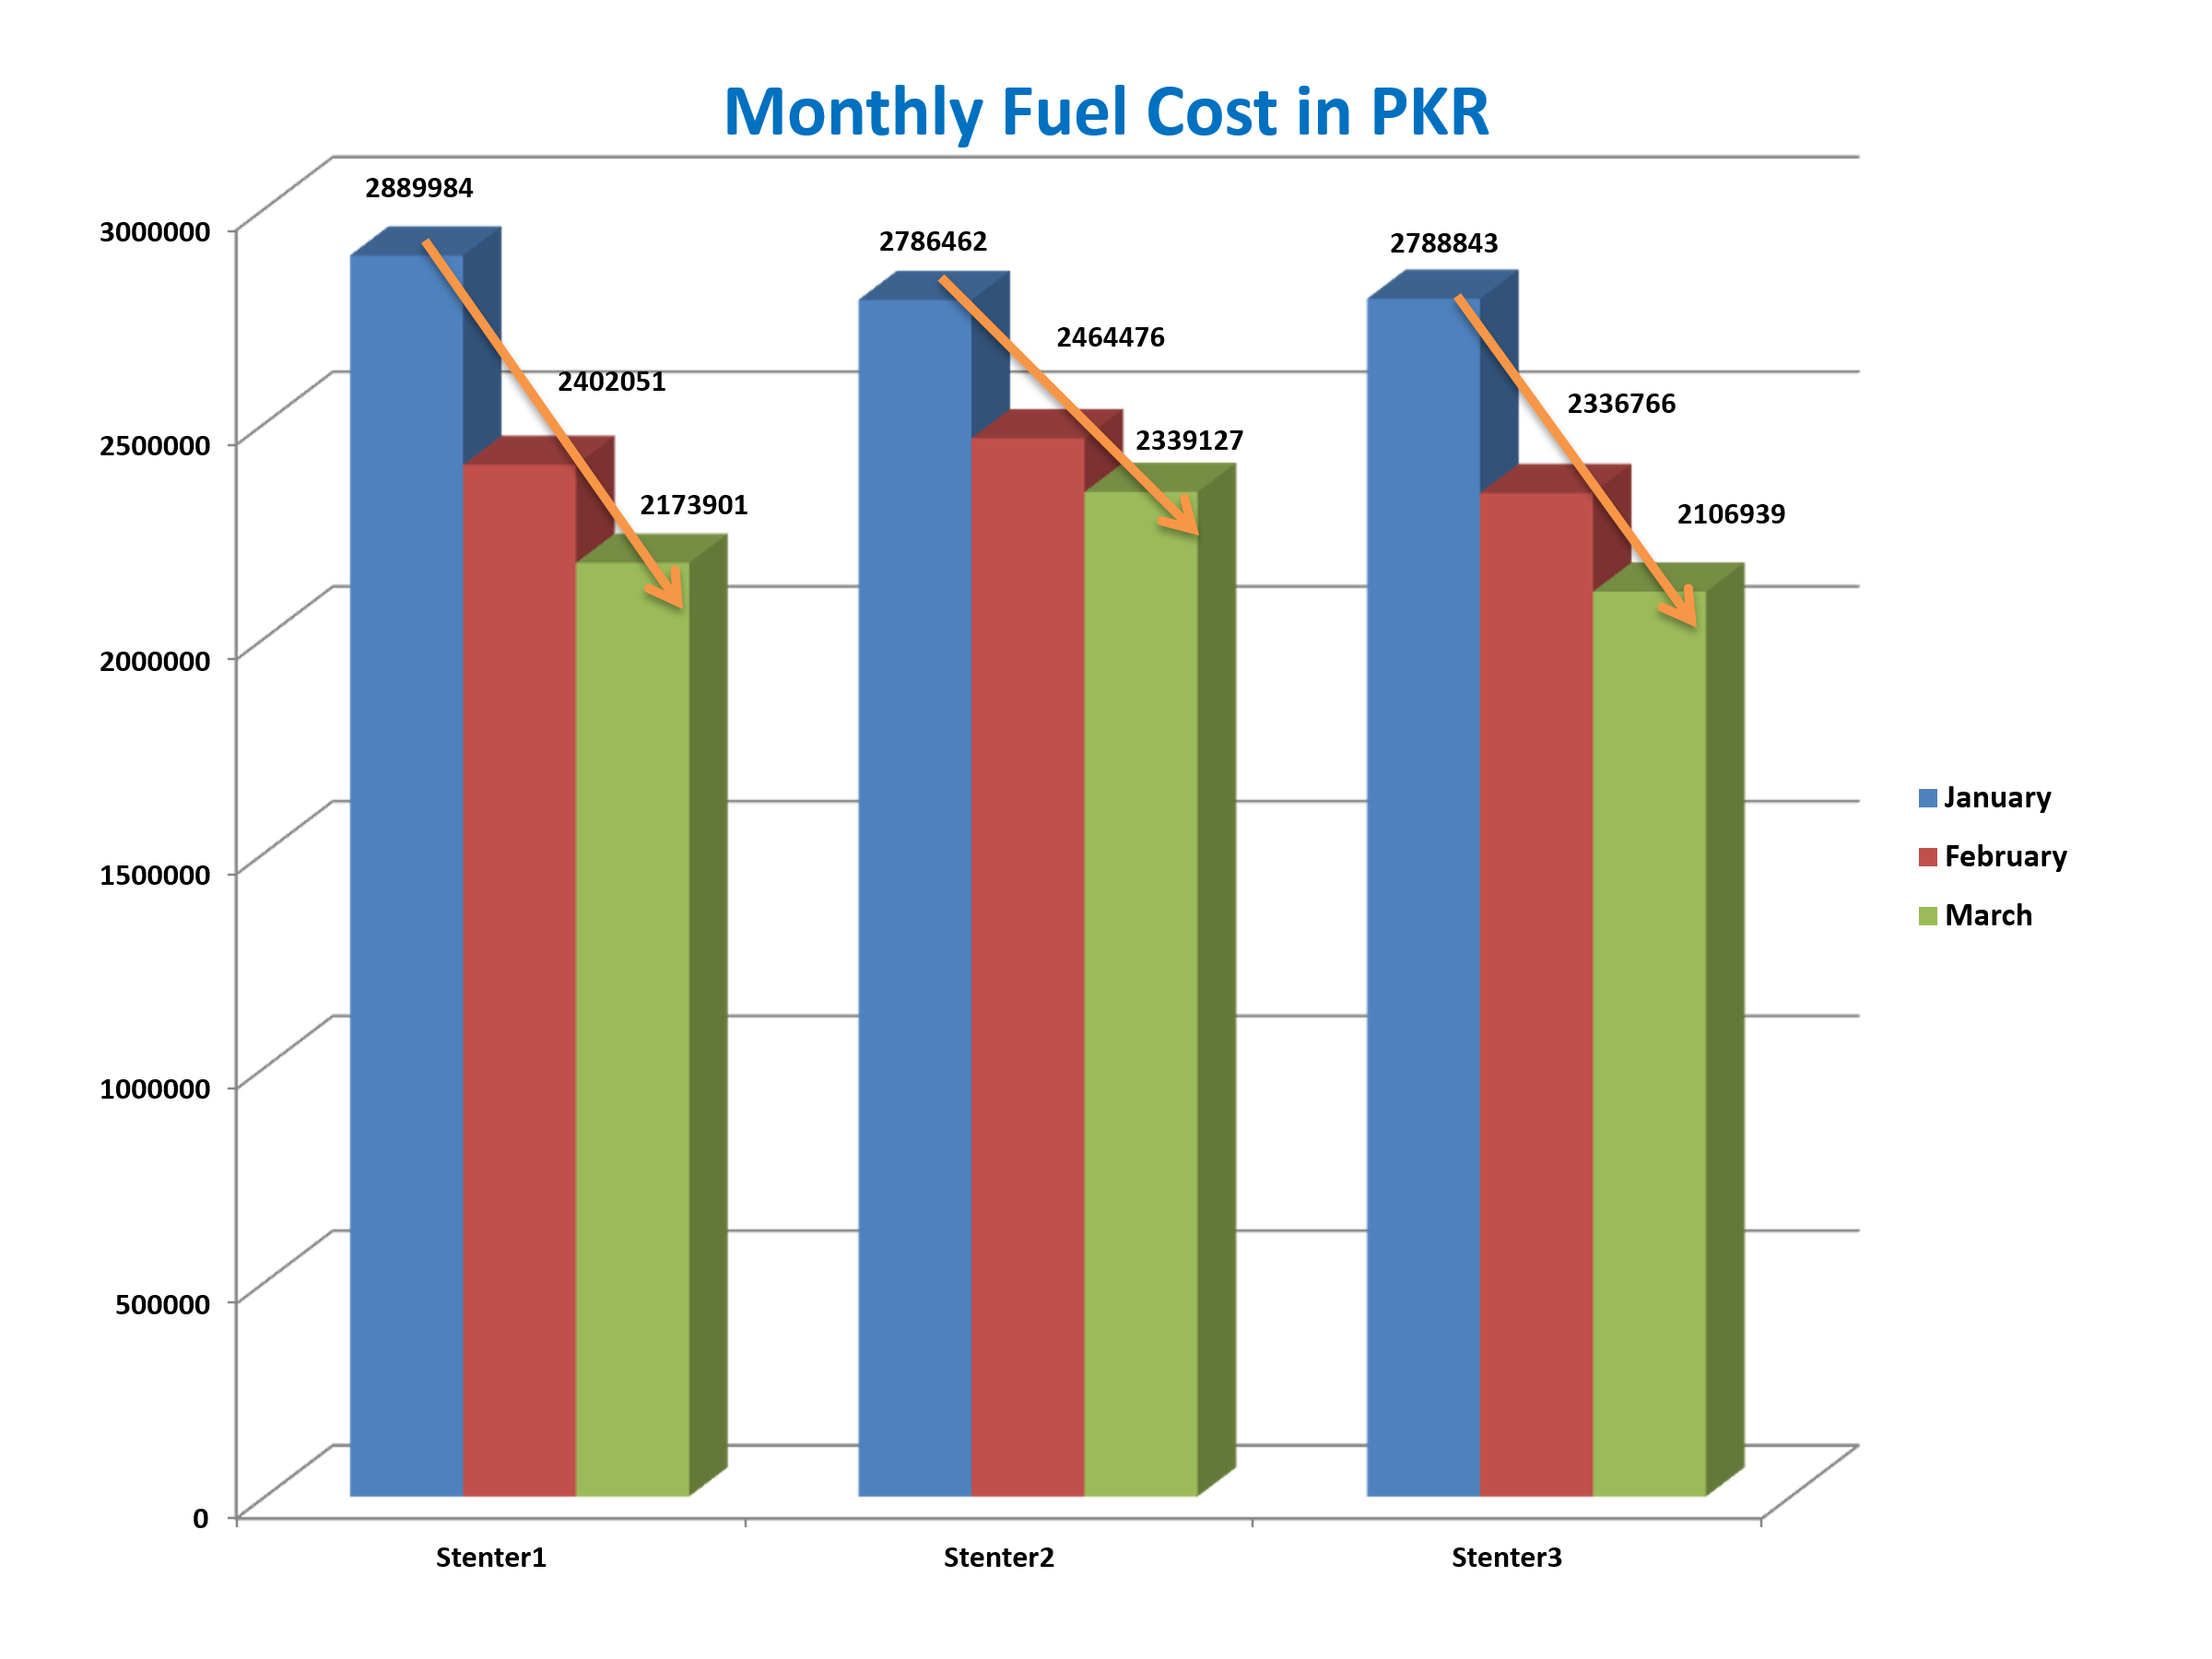
Source report detail
Project timeline and takeaways
Delivery timeline
- 1 weekCollect monthly changeover counts and operator travel-distance dataPhase 1
- 1 weekEstablish changeover-duration baseline and train in Lean TPMPhase 2
- 1 weekImplement SMED, 5S, and standard operating proceduresPhase 3
- 1 weekDevelop downtime codes and implement data recordingPhase 4
- 2 monthsImplementation monitoring and post-implementation data collectionPhase 5
Findings and recommendations in the report
- The report states average monthly fuel savings of USD 18,270.51 across three machines.
- The report states an average monthly production increase of 221,335 metres across three machines.
- Machine-filter-cleaning time reportedly improved by 17%.
- Daily stoppage reportedly decreased by 20% per machine.
- Overall Equipment Effectiveness reportedly increased by 12.27%.
- Program-change changeover time reportedly improved by 20%.
- Shade-matching changeover time reportedly improved by 10%.
- The report recommends enhanced workforce training and continued improvement in changeover practices.
- The narrative states safety issues fell from 6 to 0, but its results matrix is inconsistent; no numerical safety reduction is claimed.
Client and employee identities are withheld. Reported figures are retained as source claims; discrepancies are noted rather than silently corrected.
03 · Outcomes
What changed
- 01The report states average monthly fuel savings of USD 18,270.51 across three machines.
- 02Average monthly production increased by 221,335 metres across the three machines, according to the report.
- 03The source records a 12.27% increase in OEE, a 20% reduction in daily stoppage, and a 17% improvement in filter-cleaning time.
- 04Program-change and shade-matching changeover times were reported to improve by 20% and 10%, respectively.
- 05The report narrative states that safety issues fell from 6 to 0, but its results matrix is inconsistent on the final count; no numerical safety reduction is claimed here.
Client identity is withheld. Outcomes and measures are presented as documented in the engagement source material.