Ceramics & Distribution · Consulting
Improving ceramic sorting consistency with Measurement System Analysis
A six-week sorting improvement engagement used Six Sigma Measurement System Analysis, targeted training, standard work, and workplace changes to address grade misclassification and customer complaints.
- 35%
- reported improvement in sorting performance
- USD 28,000
- reported reduction in misclassification losses
- USD 67,000
- annual gain stated in the source report
01 · Context
The challenge
- The final sorting process was not adequately optimized.
- Sorters sometimes placed grade A products into grade B and vice versa.
- Misclassification resulted in company losses.
- Customer complaints increased because of incorrect sorting.
- Misclassification damaged the company's reputation.
02 · Delivery
The approach
- 01Applied the Deming PDCA process-improvement method and formed a dedicated team.
- 02Trained the team in Six Sigma Measurement System Analysis.
- 03Provided root-cause analysis training using Fishbone diagrams and the 5 Whys.
- 04Used Minitab to analyze sorter-performance variation; individual names are withheld here.
- 05Identified and trained underperforming team members.
- 06Developed and implemented standard operating procedures.
- 07Introduced improved lighting above 1,000 lux.
- 08Introduced mandatory breaks every two hours to help reduce eye strain.
Engagement evidence
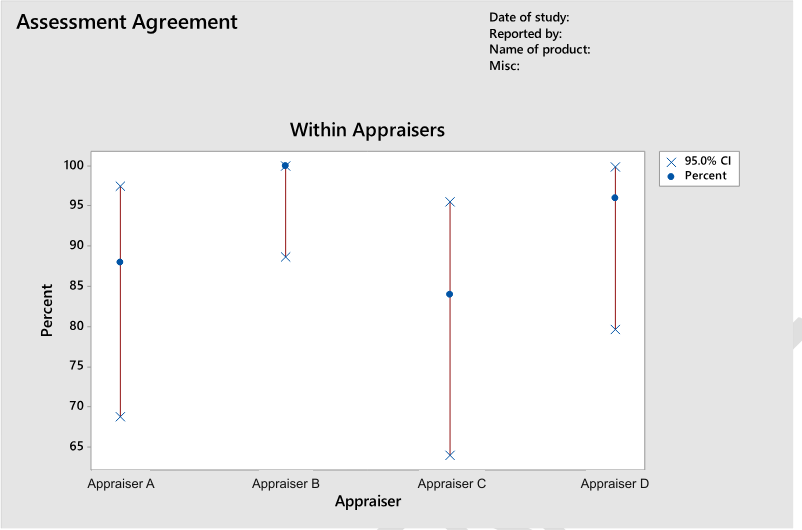
Measurement System Analysis and financial results
Reported financial results
The totals and labels below are reproduced as stated in the source report.
| Category | Before | After | Savings / benefit | Improvement |
|---|---|---|---|---|
| Misclassification losses | USD 80,000 | USD 52,000 | USD 28,000 | 35% |
| Repeat orders | USD 0 | USD 25,000 | USD 25,000 | 1% |
| Contract retention | USD 0 | USD 10,000 | USD 10,000 | Secured contracts |
| Total annual benefit (as reported) | USD 80,000 losses | USD 87,000 net benefit | USD 67,000 gain | — |
The component savings add to USD 63,000, while the source separately reports a USD 67,000 annual gain; these reported figures are shown without reconciliation.
Source report detail
Project timeline and takeaways
Delivery timeline
- 1 weekProblem analysis and data collectionPhase 1
- 1 weekTeam formation and trainingPhase 2
- 1 weekMeasurement System Analysis implementationPhase 3
- 1 weekSolution implementationPhase 4
- 2 weeksMonitoring and controlPhase 5
Findings and recommendations in the report
- The report says Minitab analysis identified variation in sorter performance; named appraisers are anonymized.
- The report describes targeted training and SOP enforcement to improve sorting accuracy.
- Sorting performance reportedly improved by 35% within two weeks.
- Repeat orders reportedly increased by 1%.
- Additional contracts were reportedly secured.
- The source lists misclassification losses falling from USD 80,000 to USD 52,000, repeat orders of USD 25,000, and contract retention of USD 10,000.
- The source's component savings sum to USD 63,000, while it separately states a USD 67,000 annual gain; the figures are retained without reconciliation.
- The report's recommendations include a more optimized sorting process, less rework, fewer customer complaints, and an enhanced company reputation.
Client and employee identities are withheld. Reported figures are retained as source claims; discrepancies are noted rather than silently corrected.
03 · Outcomes
What changed
- 01The report records a 35% improvement in sorting performance within two weeks.
- 02Reported misclassification losses decreased from USD 80,000 to USD 52,000, a stated USD 28,000 reduction.
- 03The source reports higher repeat-order and contract-retention values after the changes.
- 04The report's component benefits total USD 63,000, while it separately states a USD 67,000 annual gain; the source figures are shown as reported and are not reconciled.
Client identity is withheld. Outcomes and measures are presented as documented in the engagement source material.